
Dynamic History
Population and Representation | FREE Dynamic History Module | Grades 9-12
Population and Representation | FREE Dynamic History Module | Grades 9-12
Couldn't load pickup availability
Classroom Use at a Glance
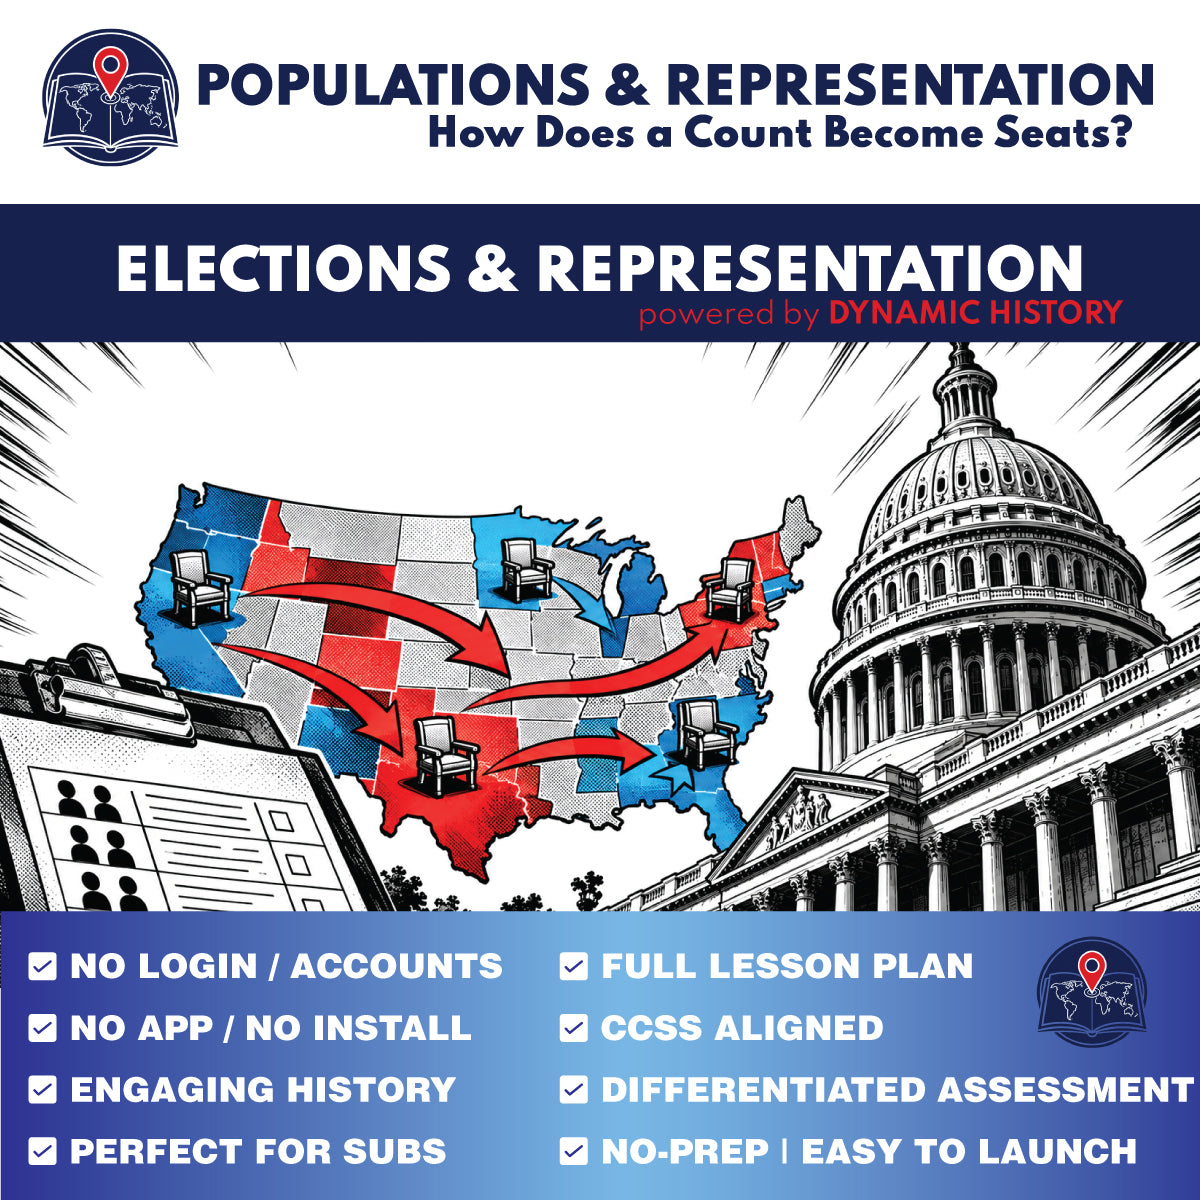
A complete FREE grades 9-12 Dynamic History lesson on Population and Representation. Includes a six-stop two-day interactive investigation, Teacher Guide and Answer Key, Standard and Accessible reading levels inside the module, editable digital and printable student worksheets, a self-graded Google Forms quiz, an MC print quiz, and an assessment bank with 5 vocabulary terms, 4 two-part short-answer questions, 2 two-part challenge questions, and 15 multiple-choice questions.
Make the connection between the census and representation concrete with this FREE two-day Dynamic History investigation for grades 9-12. Students follow the constitutional count from 1790 to the modern 435-seat House and ask how population totals become representation.
Students distinguish the census count from the apportionment formula, examine Washington's 1792 veto, explain why the 1920 census produced no new apportionment, and trace the laws that made reapportionment automatic. The final stops use long-term seat shifts and the 2020 census to show how a fixed House changes as population shares change.
What students investigate
- Article I, the decennial census, and population-based House representation
- The 1790 census and the difference between total residents and the apportionment figure
- Washington's 1792 veto and the early problem of choosing a House size and apportionment method
- Growth of the U.S. House from 105 seats to the modern fixed total of 435
- The 1920 census and Congress's failure to complete a new apportionment
- The Reapportionment Act of 1929 and automatic reapportionment
- The method of equal proportions and the modern 435-seat system
- House-seat shifts from 1960 to 2020 and the seven seats moved after the 2020 census
What's included
- Two-day guided Dynamic History investigation with six mapped stops
- Teacher Guide and Answer Key with Day 1 and Day 2 pacing
- Standard and Accessible reading levels inside the interactive module
- Editable digital student worksheet generated in Google Slides
- Printable student worksheet generated in Google Slides
- Self-graded Google Forms quiz and MC print quiz
- Assessment bank with 5 vocabulary terms, 4 two-part short-answer questions, 2 two-part challenge questions, and 15 multiple-choice questions
Flexible classroom use
- Teach the core investigation across two 45-50 minute class periods
- Project the interactive module for whole-class instruction or use individual/shared student devices
- Use the digital worksheet for typed responses or the printable worksheet for paper-based response work
- Use selected written questions for homework, review, or a short check for understanding
- Use the complete assessment as a separate assessment period when desired
Skills addressed
- Distinguishing census counts, apportionment populations, House size, and seat allocation
- Tracing cause and effect across constitutional text, laws, political decisions, and census results
- Using maps, charts, official records, and numerical evidence to support explanations
- Explaining how relative population growth can change representation even when a state's population increases
- Evaluating what a statistic or historical source supports without claiming more than the evidence shows
Standards alignment
CCSS History/Social Studies literacy connections documented in the Teacher Guide include RH.9-10.1, RH.9-10.2, RH.9-10.7, RH.9-10.9 and corresponding RH.11-12 standards where appropriate. Written extensions may also support WHST.9-10.1, WHST.9-10.2, WHST.9-10.9 and corresponding WHST.11-12 standards.
Digital and print student outputs
The shared Google Classroom folder contains the editable digital worksheet, printable worksheet, self-graded quiz, MC print quiz, and source Teacher Guide generated from the final assessment bank. The Standard and Accessible reading levels are available inside the interactive Dynamic History module.
Share